You care about your driver's center of gravity. You may not realize it yet, but you do. It's the single biggest influencer of how your driver performs.
While the average golfer may not know what center of gravity is, or why it matters (in fact, he may not even care), there's a reason why it (CG) is a part of the discussion that accompanies nearly every driver release.
PING's centers of gravity have traditionally been low and back. With SLDR, TaylorMade set the bar for low and forward. Last year, Cobra went Zero CG, and Callaway went Sub Zero.
The point is that every driver has a center of gravity, and no two are the same.
But what does any of that mean, and of equal importance, who is telling the truth about CG location?
That's what this annual post is all about.
Today we're going to show you exactly what's real when it comes to the actual center of gravity placement of this season's hottest drivers. By the time we're done, hopefully, you'll understand why CG matters too.
Interpreting the Data
For those of you who are stumbling across our CG charts for the first time, and may be wondering what they are, and why they matter, we're not going to rehash all of that here. I would encourage you to check out any and all of our previous posts on the topic.
- Golf Geeks - How Center of Gravity Makes a Huge Difference
- 2015 Driver CG Data
- 2016 Driver CG Data
- 2016 Driver CG Data Update 1
THE FINE PRINT
Before we get to our charts, it's important to understand that although heads were measured according to USGA standards, tolerances (both in measurement and in manufacturing) come into play. The tolerance for our measurements is approximately .7mm. To account for this, we represent CG using large dots rather than a smaller absolute point.
We should also note that of the companies that publicly state driver CG locations, most do so based on measurements from CAD drawings. Between manufacturing, assembling, welding and polishing, CAD projections don't always align with the finished product. Our data comes from actual retail parts.
Where the dots in our charts are touching or are in close proximity to one another, it's reasonable to assume the heads have similar performance characteristics.
Finally, although we've blown these charts up to make them a bit easier to read, every last one of the CG locations represented is within that tiny little 14mm x 12mm box previously described in our CG Primer.
Interacting with the Charts
For each of the charts displayed below, we've defaulted to new (2017) drivers only. Provided filters allow you to add or remove clubs based on any combination of Year, Manufacturer, and Model. We recommend that, for additional context, you view the charts with previous year's models selected. Additionally, you can:
- Click on any model name at the top of the chart to isolate that club
- Hold down Ctrl while clicking to isolate multiple clubs
- Hover over any dot to reveal additional information, including the relevant weight setting and the actual measurements
With all of that out of the way, let’s get to out 2017 data:
CG YZ (CG RELATIVE TO FACE CENTER)
The chart below shows the YZ (top to bottom/front to back) CG location relative to the center of the face for the drivers measured. Effectively, the area shown represents that 14mm x 12mm box within the clubhead. These measurements depict CG locations without consideration for their relationship to the neutral axis. As such they are not loft dependent. Basically, the chart shows the actual CG location for each driver measured.
CG YZ Chart
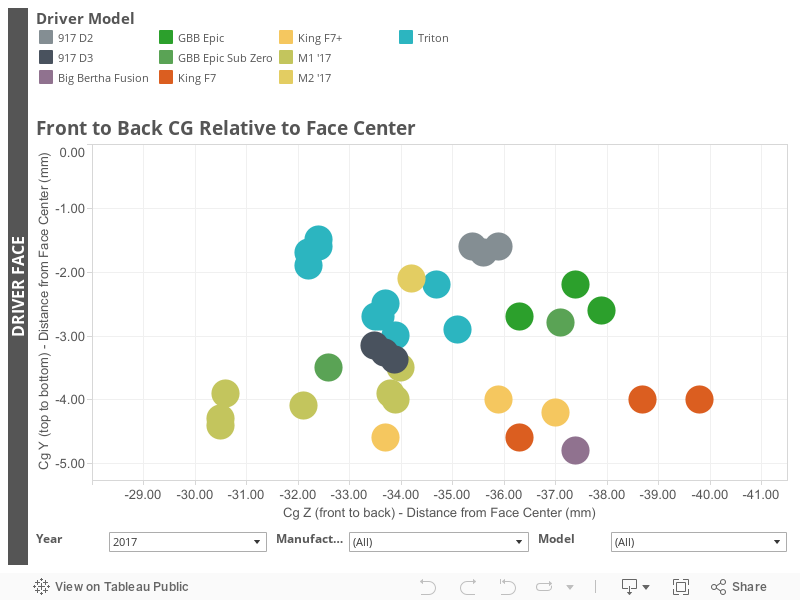
Observations:
- We are planning on adding some additional drivers in a future update, the count of 2017 drivers is a bit lighter than past seasons.
- Compared with the 2016 model, TaylorMade significantly increased the range of CG movement with M1.
- Callaway (Epic Sub-Zero) and to a slightly lesser extent Cobra (F7 and F7+) offer significant CG movement, while front to back and top to bottom CG movement with the Titleist 917 (D2 and D3) is comparably limited.
- CG Position of the Wilson Triton can vary significantly based on both the sole plate used and the weight placement.
- Of the newly measured models, Callaway's Big Bertha Fusion has the lowest center of gravity, the Triton has the highest, the Cobra F7 has the more rearward, and the M1 is the most forward.
CG Relative to the NEUTRAL AXIS & MOI
As illustrated by the image above, the neutral axis is an imaginary line running perpendicular to the center of a lofted driver face. Before you ask, let me tell you why that matters. As the center of gravity moves closer to the neutral axis, you get less gearing (twisting), and a more efficient transfer of energy between the club and ball. As with everything else in our CG discussion, the distance from the center of gravity to the neutral axis (or CG NA as it's called for short) is measured in millimeters and those millimeters matter.
Many golf companies advertise some variation of fast and forgiving, and while you might not realize it, that has everything to do with the center of gravity relative to the neutral axis. If we assume reasonably centered contact, to be fast - to reduce gearing at impact, and to maximize the efficiency of the strike - the center of gravity needs to be near the neutral axis. To be forgiving, MOI (also shown below) needs to be high. Despite what various marketing claims may lead you to believe, truly fast and truly forgiving is perhaps the most difficult combination to achieve.
Note: because both the data and the scale is fundamentally different, this chart cannot be directly compared to the Front to Back CG YZ chart above.
CGNA & MOI Chart
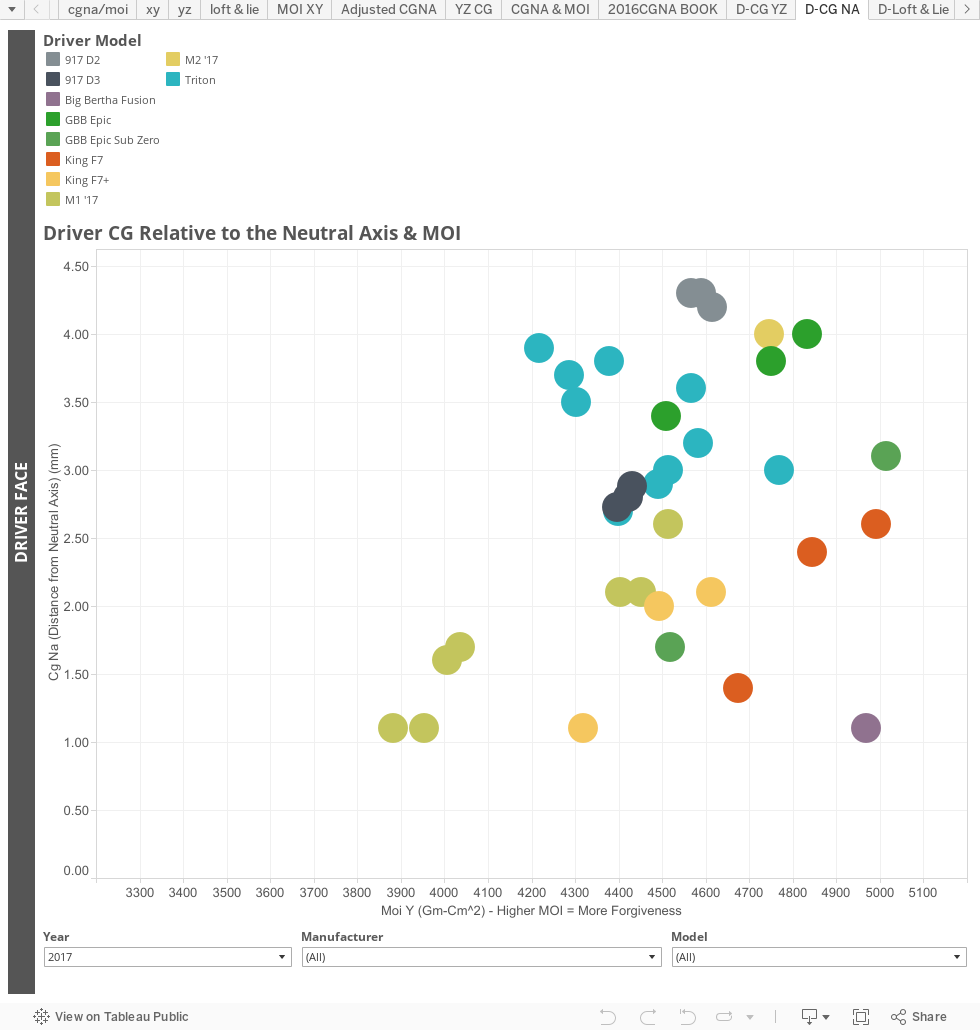
Observations:
- Unlike last season, none of the drivers measured has a CGNA location that falls below the neutral axis
- The Callaway Big Bertha Fusion and the Cobra F7+ have the lowest CG (relative to the neutral axis), while the Titleist 917 D2 has the highest.
- Surprisingly, at just above 5000, the MOI of the Callaway Epic Sub Zero is the highest of the 2017 drivers measured.
- The CGNA of the new M2 is significantly higher than the previous model. It also offers higher MOI.
- The M1's CGNA is similar in the forward position; however, the MOI of the 2017 model is higher than the 2016 version when the weight is in the rear position.
- The Cobra F7 and F7+ show similar patterns with the F7+ being the more low/forward design while the standard F7 is the more forgiving of the two.
- In any configuration, the Wilson Triton, Titleist 917 Series, TaylorMade M2 and Callaway Big Bertha Epic should be considered mid-to-high CGNA designs relative to the other 2017 drivers measured.
CG XY (Heel/Toe CG)
While the data provided in this chart is certainly interesting, it also comes with a disclaimer of sorts. CG XY is not a straightforward measurement. For example, we mind find drivers with similar XY CG locations, yet very different face heights, face shapes, crown curvatures, bulge and roll radii, etc.. XY CG similarities aside, those other design factors will likely cause the clubs to play quite differently from one another. So while this chart will give you some indication of CG movement along the club's x-axis as well as any inherent draw or fade bias, the CG NA and MOI chart should prove to be a much better performance comparison.
CG XY Chart
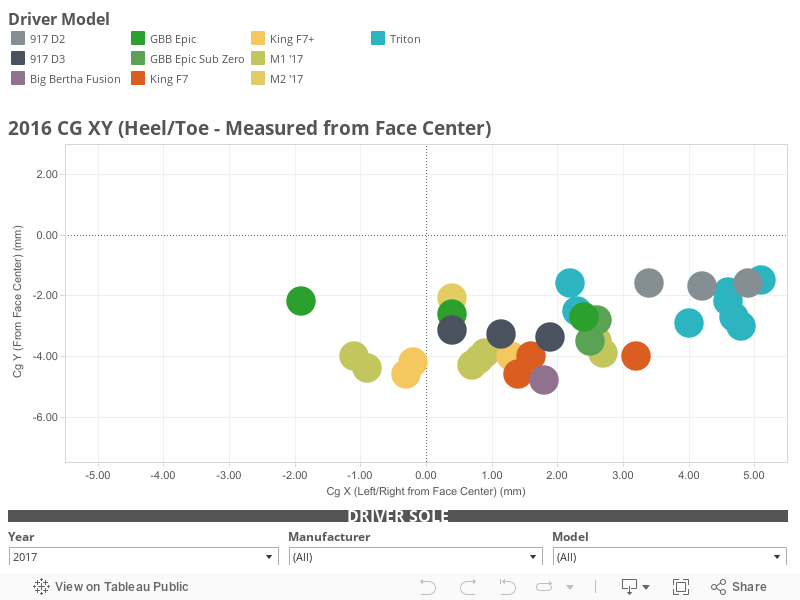
Observations:
- The vast majority of drivers and settings show a moderate to pronounced draw bias (heel side CG).
- The Callaway Big Bertha Epic shows versatile weight placement allowing for pronounced fade and draw bias settings, as well as a near true neutral setting.
- While the range is not as broad as it is with Epic, both M1 and F7+ allow the CG to moved to either side of center.
- While the Triton offers a fair amount of horizontal CG movement, the CG remains significantly heel-sided in every configuration.
- Titleist's 917 series offer a reasonable range of horizontal CG movement; however, the CG remains on the heel side in every configuration, with the D2 offering among the most draw biased CG of the drivers measured.
SO WHICH CG LOCATION IS BEST?
There is no single center of gravity location that is ideal for everyone. Different manufacturers have different philosophies and different design and manufacturing capabilities.
We believe that the widest part of the bell curve will achieve the best results with relatively high MOI and relatively low CG drivers. Slower swing speed players, who need help keeping the ball in the air, generally do well with high/back designs. Golfers who are in desperate need of spin reduction (often aggressive swingers who hit down on the ball), will likely get better results with low and forward CG drivers, even at the expense of forgiveness. High MOI is not for everyone. For golfers who consistently hit the ball high on the face, a higher CG driver may produce better results, while golfers who habitually strike the ball low on the face will likely benefit from lower CG clubs.
As we've said countless times, in golf there are no absolutes, but we believe that by identifying a general center of gravity location that works well for you, you'll be able to quickly narrow your focus to a few clubs that offer the highest probability of producing good results.
YOUR HOMEWORK
As we have in the past, we encourage you to conduct an experiment on your own. Try splitting our chart 4 ways. If you're feeling motivated, split it 6 ways. Go out and compare clubs from the different areas you define and see if you find that clubs perform more similarly within boundaries, and quite a bit differently across them. See if the drivers in one section work better for you than those in a different area.
from MyGolfSpy http://ift.tt/2ngGpi1
No comments:
Post a Comment